
Weekly Crypto Break August 14

Weekly Newsletter
3 min read time
|Updated: 2026-08-14
The crypto asset market this week was shaped by network security, stablecoin activity and a widening gap between Bitcoin spot and derivatives markets. A critical vulnerability to Ravencoin raised questions around transaction finality, while Tron strengthened its position as a major network for USDT transfers. Bitcoin derivatives activity also continued to outpace spot trading, pointing to more selective positioning and increased focus on risk management.
Ravencoin Vulnerability Puts Transaction Finality in Focus
A consensus vulnerability on Ravencoin allowed some nodes to accept invalid blocks, creating the possibility of a chain reorganization affecting roughly three days of transactions. The project recommended pausing RVN deposits and withdrawals until the network stabilizes.
Why does it matter?
Transaction finality is a core part of blockchain security. Ravencoin shows how a consensus-layer issue can affect not only market sentiment but also transfers and confidence in the underlying network. The longer-term impact will depend on how quickly the network reaches a stable state.
Tron Expands Its Stablecoin Footprint
Tron ended the second quarter with around $87.9 billion in circulating USDT and processed $2.1 trillion in USDT transfers during the period. Network activity also increased, although growth was less pronounced across DeFi metrics.
Why does it matter?
Stablecoin competition is increasingly about real transaction activity rather than token supply alone. Tron's scale highlights how individual networks can develop specialized roles as payment and transfer infrastructure, although the ecosystem remains heavily dependent on USDT.
Bitcoin Derivatives Outpace Spot Activity
Bitcoin futures-to-spot volume reached a ratio of 7.82, highlighting a growing gap between derivatives and spot market activity. Data also suggests that spot demand has softened, while traders are increasingly using derivatives for short-term positioning and risk management.
Options markets are showing a similar trend, with some participants adding protection ahead of potential volatility in September. This does not provide a clear directional signal, but it does point to more cautious positioning.
Why does it matter?
A market increasingly driven by derivatives can become more sensitive to leverage and short-term positioning. The key signal to watch from here will be whether spot demand begins to recover alongside derivatives activity.
Bitcoin Price Chart
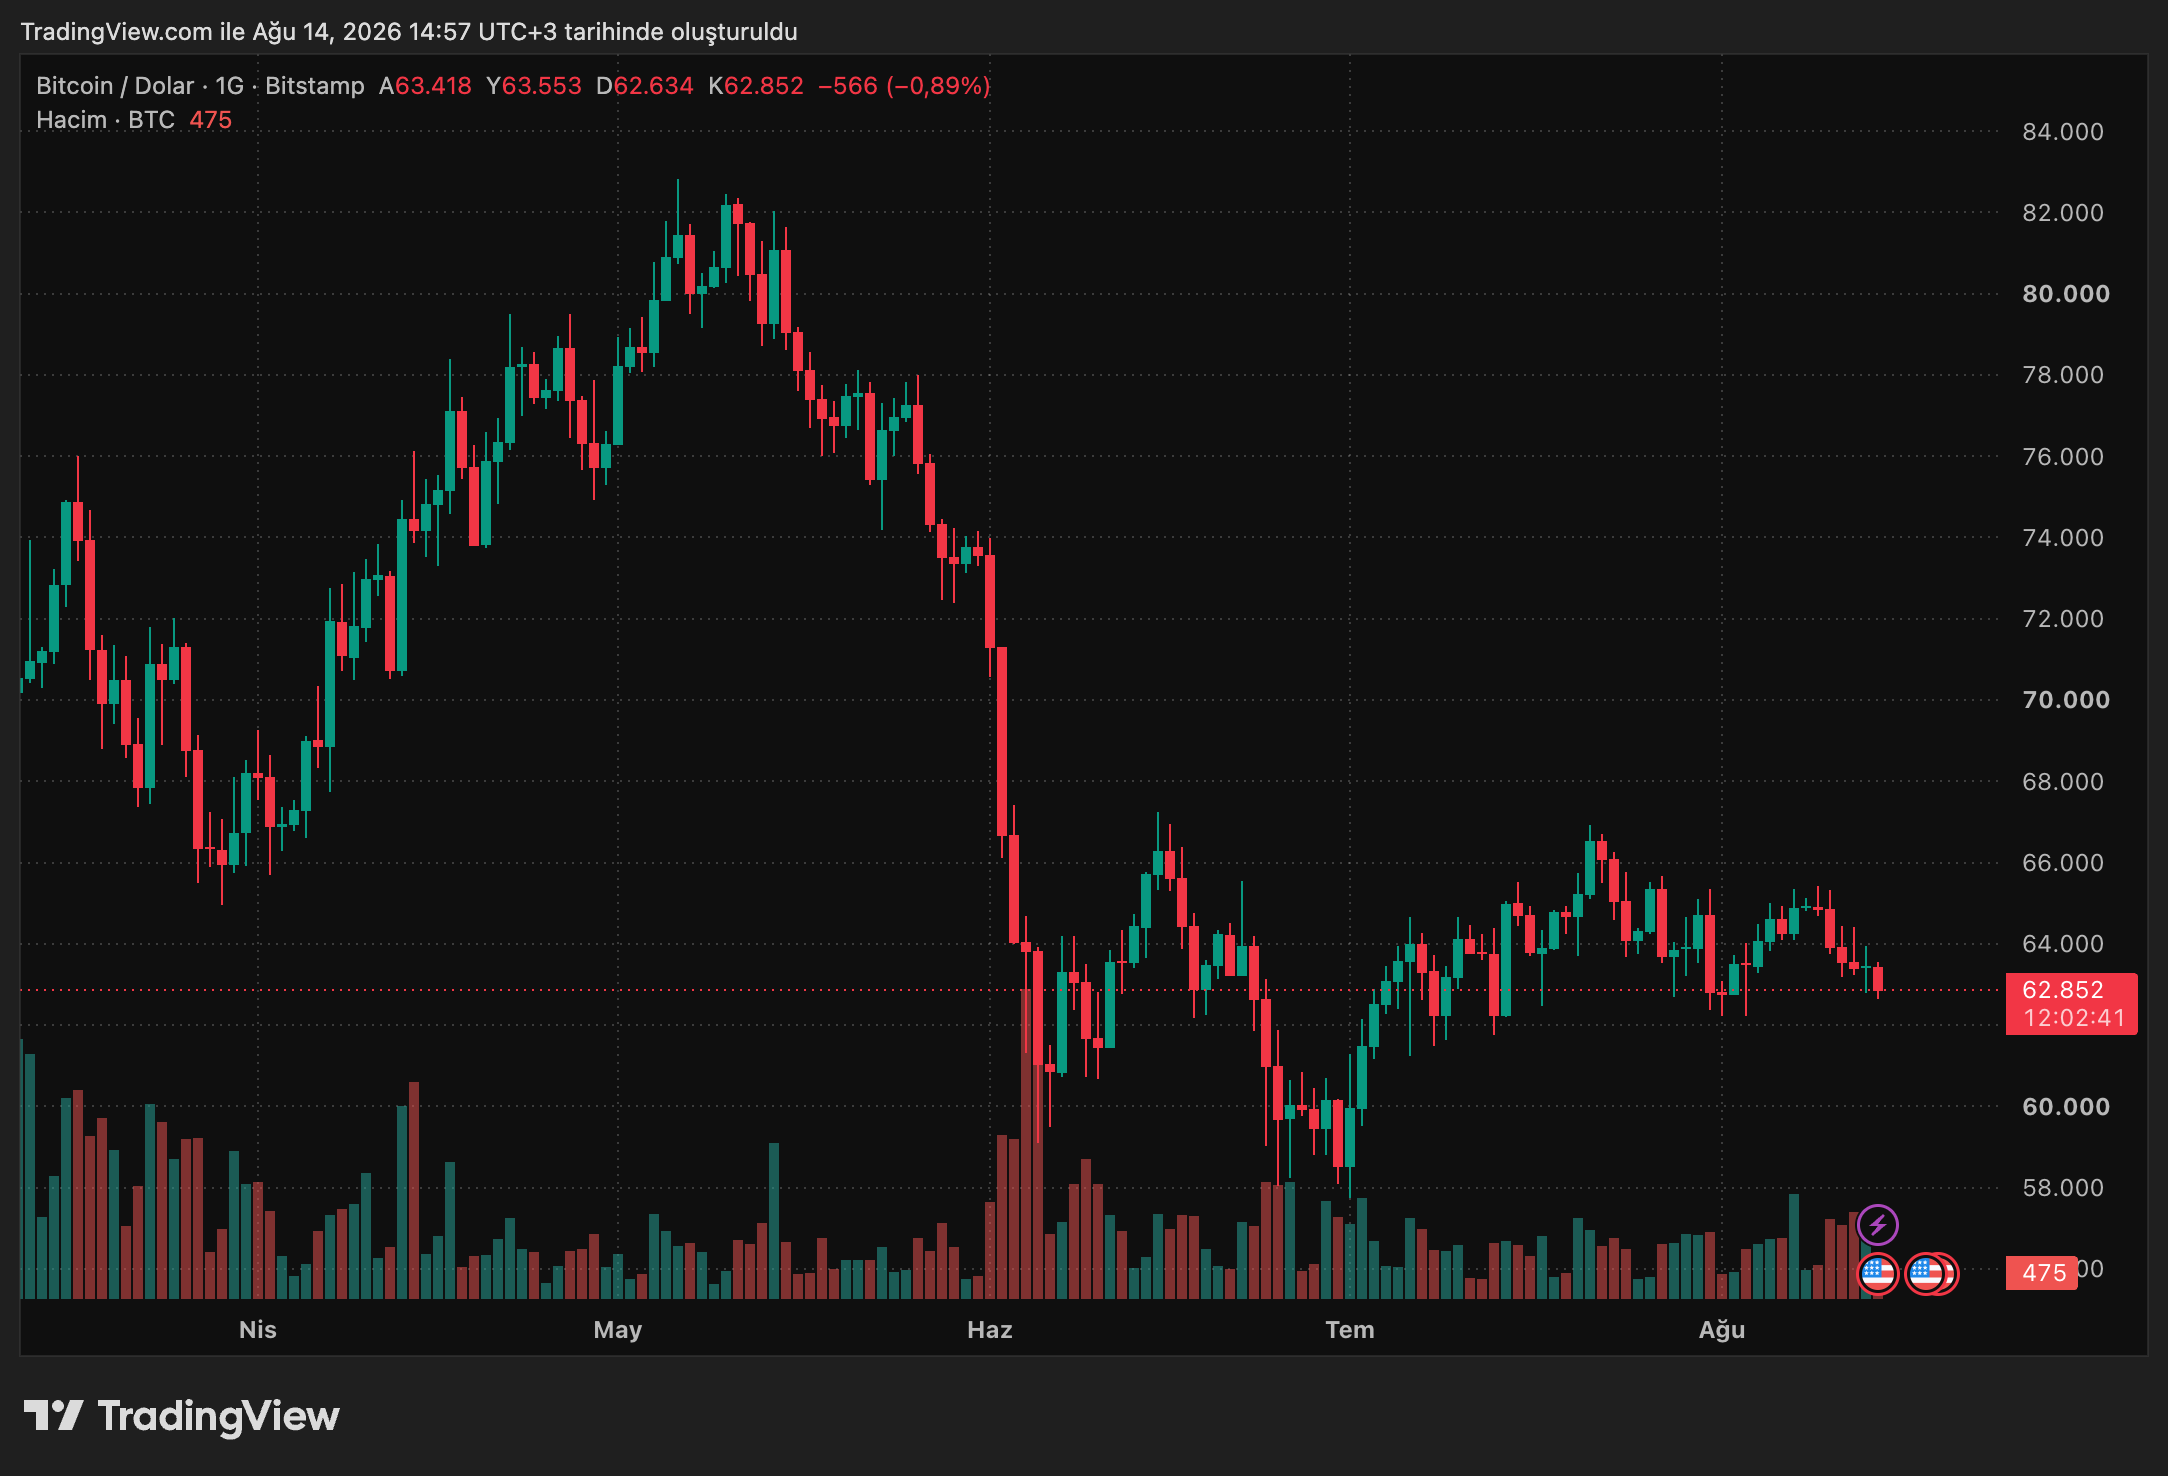
Bitcoin was trading at approximately $62,852 at the time of writing. According to TradingView data, BTC has declined by around 2.2% over the past week. As the price continues to hold above $60,000, the $62,000–$63,000 range stands out as a short-term consolidation zone.
In the event of upward momentum, the $64,000–$65,000 range
could come back into focus. The current outlook suggests that, rather than establishing a strong directional trend, Bitcoin is continuing to search for a new price equilibrium.
Ethereum Price Chart
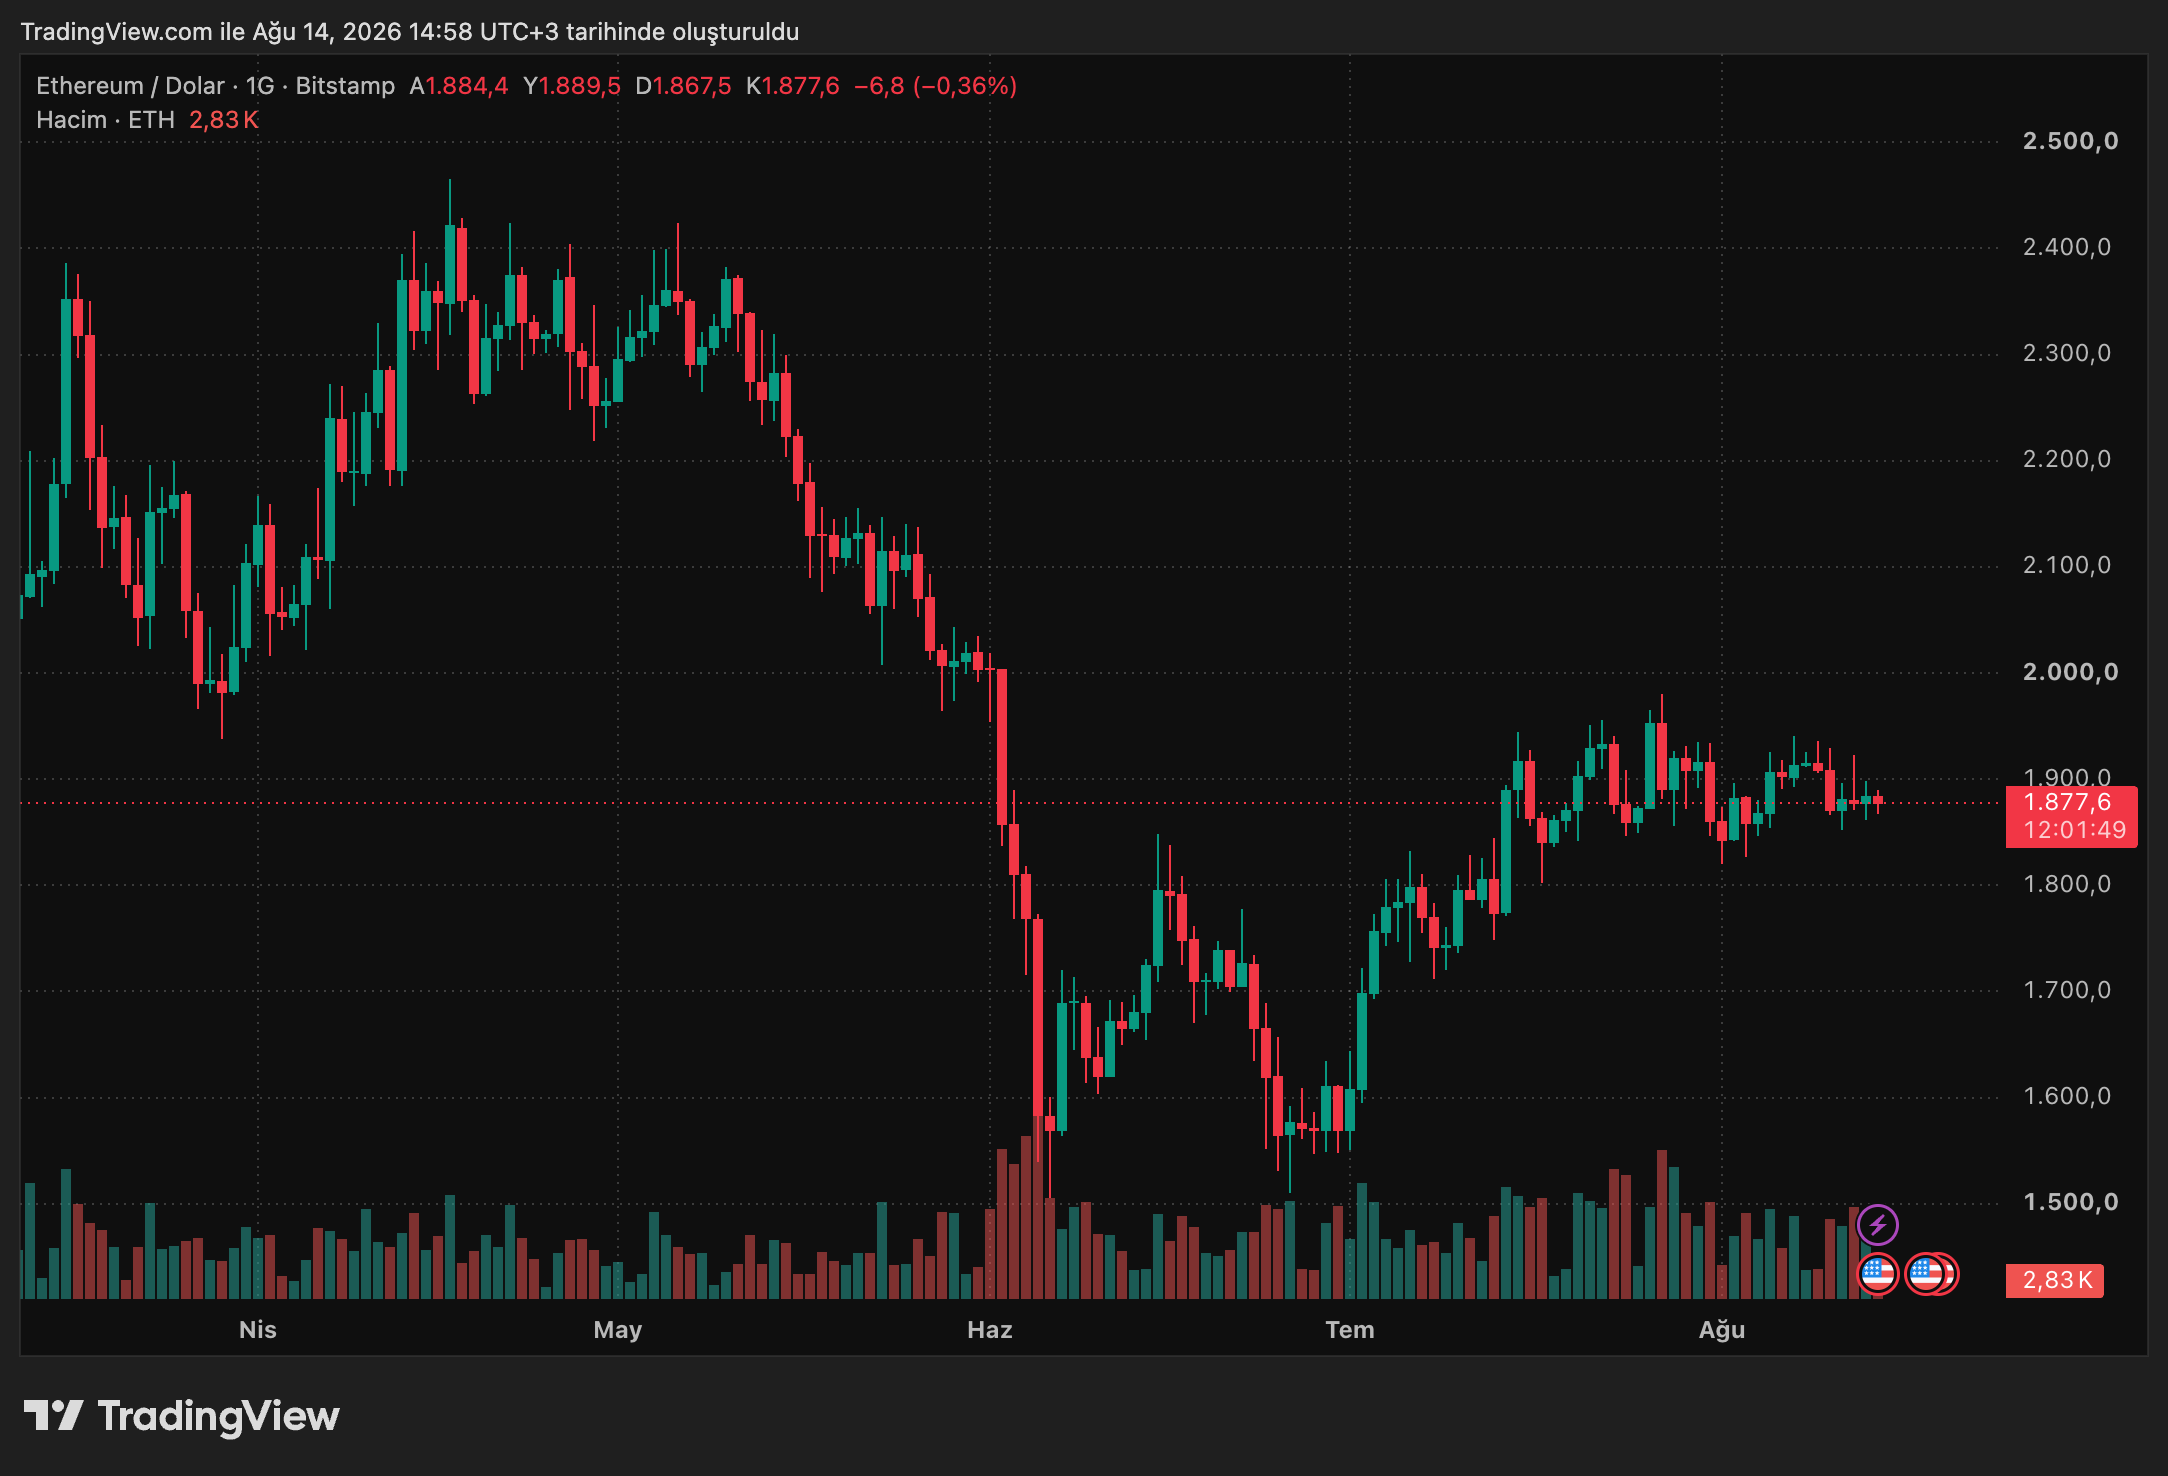
Ethereum was trading at approximately $1,877 at the time of writing. ETH’s weekly performance indicates a decline of around 1.7%, with the $1,900 level emerging as a key area to watch for short-term direction.
A sustained move back above $1,900 could support a recovery, while the current outlook suggests that Ethereum, similar to Bitcoin, is searching for equilibrium within a relatively narrow range.
 2026-08-14
Legal Notice
The information, comments, and evaluations contained in this content do not constitute investment advice. This content is not intended to be prescriptive in any way and is intended to provide general information. It does not constitute investment advice. CoinTR cannot be held responsible for any transactions made based on this information or any losses that may arise.
 Weekly Crypto Break August 21
Recommended
 Weekly NewsletterWeekly Crypto Break October 2 In the cryptocurrency market, new steps toward stablecoin regulation in the U.S., third-quarter fund flows in spot Bitcoin and Ethereum ETFs, the launch of the application process for the UK’s new crypto asset regime, and the impact of the U.S. government shutdown on regulatory processes were among the main topics between September 25 and October 2. The Fed opened two new draft regulations for payment stablecoin issuers for public comment. U.S.-listed spot Bitcoin and Ethereum ETFs ended the th2026-10-02
 Weekly NewsletterWeekly Crypto Break September 25 In the cryptocurrency market, spot Bitcoin and Ethereum ETF flows, blockchain-based payment infrastructure developed by traditional financial institutions, initiatives related to the international use of stablecoins, and regulatory developments in the U.S. were among the main topics between September 18 and September 25. U.S.-listed spot Bitcoin and Ethereum ETFs recorded approximately $877 million in total net inflows on September 22. Swift moved into the first use phase of its blockchain-base2026-09-25
 Weekly NewsletterWeekly Crypto Break September 18 In the cryptocurrency market, the Federal Reserve’s interest rate decision, spot Bitcoin ETF flows, a new stablecoin-focused blockchain infrastructure, and crypto asset regulations in the United Kingdom were among the main topics between September 11 and September 18. The Fed raised its policy rate by 25 basis points, while U.S.-listed spot Bitcoin ETFs recorded their largest daily net outflow since June. On the stablecoin side, Circle launched the public mainnet of the Arc network. The UK Fina2026-09-18
