
Weekly Crypto Break August 28

Weekly Newsletter
4 min read time
|Updated: 2026-08-28
The
crypto market this week was shaped by ETF demand for Bitcoin, corporate capital management and increasing usage across blockchain networks. Bitcoin’s weekly price increase in dollar terms reached a historic level, while spot ETF inflows recording their strongest week since October 2025 indicated that institutional demand was accelerating again.
On the Strategy side, a more flexible balance-sheet approach focused on strengthening cash reserves rather than making new Bitcoin purchases drew attention. Solana, meanwhile, reached a record number of transactions in July, while growth in tokenized real-world assets showed that network usage was expanding beyond price movements.
Strategy Expands Cash Reserves While Pausing BTC Purchases
Strategy raised approximately $2 billion through common stock sales between August 17 and August 23 without making any new Bitcoin purchases. The company transferred part of the proceeds to a newly created cash account, adding $1.59 billion in liquidity. Its Bitcoin holdings remained unchanged at 840,447 BTC.
The company stated that the newly created cash pool could provide greater flexibility for Bitcoin purchases, debt payments and other capital management needs. This approach shows that greater emphasis is being placed on liquidity management while maintaining the long-term Bitcoin strategy.
Why does it matter?
Strategy’s decision to strengthen its cash position while pausing new Bitcoin purchases shows that balance-sheet flexibility, not only asset accumulation, is becoming increasingly important in corporate crypto strategies. The company’s next steps will be watched to see whether its stronger cash reserves are used for new BTC purchases or for debt and capital management.
See.
How to buy Bitcoin?
Bitcoin ETF Demand Supports the Weekly Move
Bitcoin’s weekly close rose from $62,818 to $77,593, recording a $14,775 increase in dollar terms. According to Galaxy Research, this was the largest weekly dollar increase in Bitcoin’s history, while in percentage terms it marked the strongest weekly performance since March 2023.
During the same period, US
spot Bitcoin ETFs also recorded their highest weekly net inflows since October 2025. On the macro side, the US Treasury Department’s plan to increase long-term bond buybacks and regulatory expectations were also among the factors supporting market sentiment.
Why does it matter?
The fact that the price move coincided with ETF inflows is an important signal that Bitcoin’s recovery was not driven solely by short-term market positioning. However, whether ETF demand continues in the coming weeks will be closely watched in terms of the sustainability of the current momentum.
Solana Network Activity Reaches a Record Level
Solana reached a new monthly record with 4.2 billion transactions in July. The number of transactions on the network increased by 13.5% from the previous month, while the expansion seen since December pointed to a significant strengthening in user and application activity on Solana.
Growth was not limited to transaction numbers. The value of tokenized real-world assets on Solana reached approximately $4 billion, while the SOL price also increased by around 40% over an eight-day period.
Why does it matter?
The fact that transaction growth on Solana coincided with RWA activity shows that network usage is not growing solely through market movements or short-term trading interest. As tokenized assets gain a larger role in blockchain infrastructure, this could also expand the role of high-throughput networks such as Solana in institutional use cases.
Bitcoin Price Chart
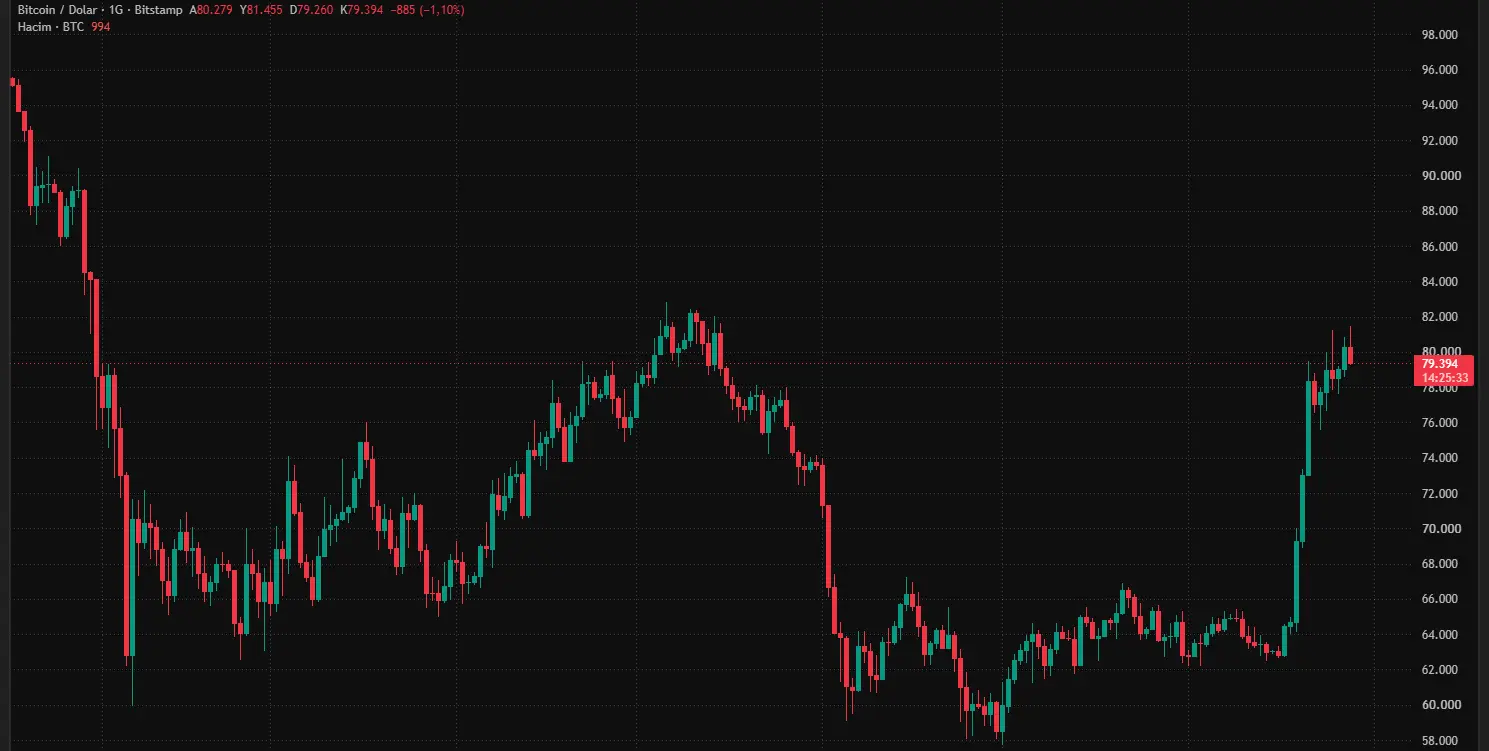
Bitcoin price closed at approximately $78,334 on August 21, maintained its upward trend throughout the week and tested levels above $81,000 several times between August 25 and August 28. As of August 28, the price is trading around $79,800.
In the short term, the $78,000–$79,000 range stands out as a new balance area, while the $81,000–$81,300 region is the first area being watched during the week’s upward moves. Stronger ETF inflows are supporting the Bitcoin outlook, while whether the price can maintain its position above the current range may be decisive for short-term direction.
Ethereum Price Chart
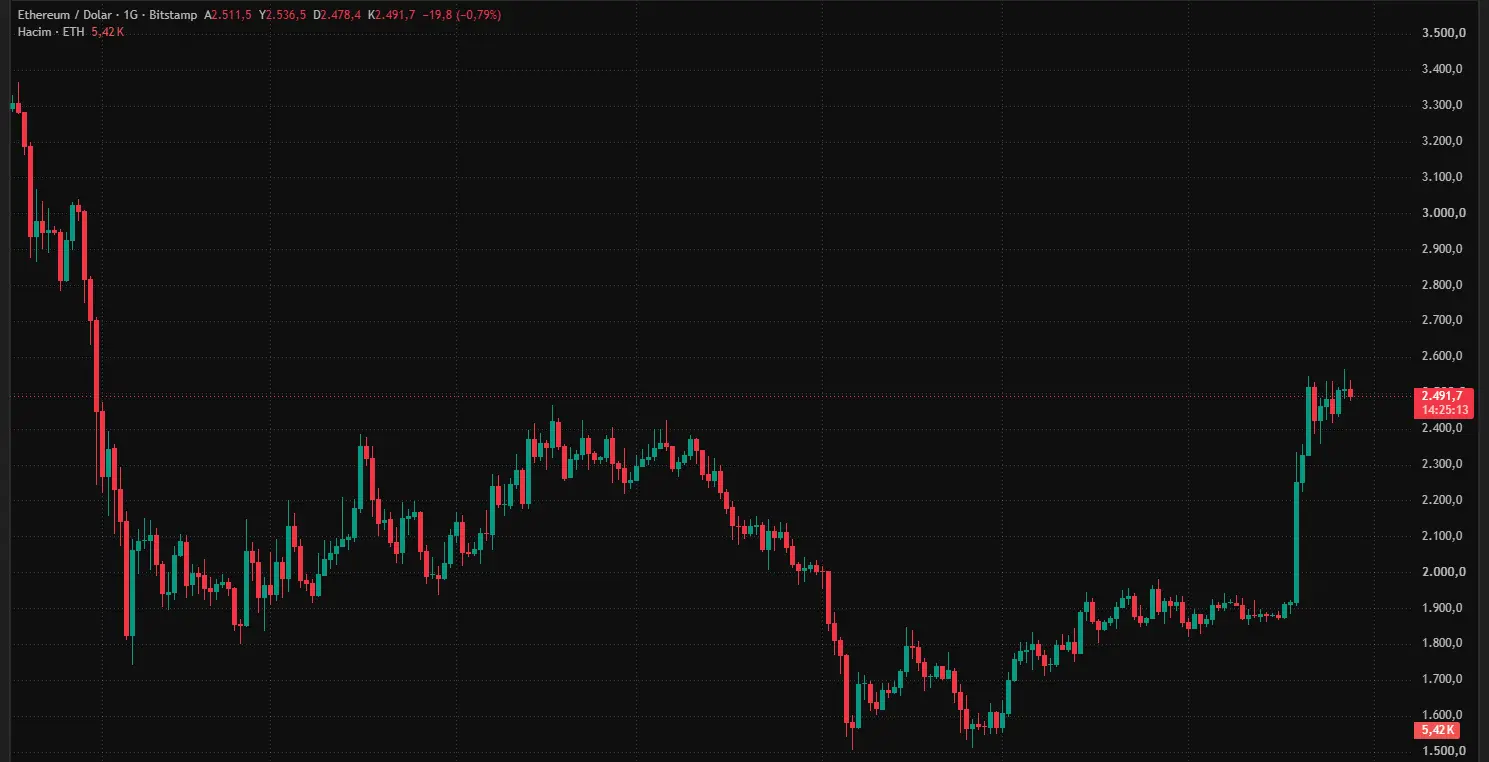
Ethereum price closed at approximately $2,515 on August 21 and then searched for balance within the $2,400–$2,550 range throughout the week. ETH tested around $2,559 on August 27 and is trading at approximately $2,490 as of August 28.
In the short term, the $2,400–$2,450 range stands out as a support area, while the region around $2,550 remains an important reference for upward moves. The weekly outlook suggests that Ethereum is trying to maintain price balance at current levels following the strong rise in the previous week.
 2026-08-28
Legal Notice
The information, comments, and evaluations contained in this content do not constitute investment advice. This content is not intended to be prescriptive in any way and is intended to provide general information. It does not constitute investment advice. CoinTR cannot be held responsible for any transactions made based on this information or any losses that may arise.
 Weekly Crypto Break September 4
Recommended
 Weekly NewsletterWeekly Crypto Break October 23 The crypto asset market this week was shaped by rapid changes in spot ETF flows, continued outflows from Ethereum funds and Strategy’s capital management moves. More than $635 million flowed out of Bitcoin ETFs in a single day following a strong three-day inflow streak, bringing the sensitivity of institutional demand to price movements back into focus. Ethereum ETF net outflows exceeded $1 billion in October, while Strategy continued to buy Bitcoin but allocated a larger share of its capital t2026-10-23
 Weekly NewsletterWeekly Crypto Break October 16 The crypto asset market this week was shaped by spot ETF flows, US inflation data and new steps from regulatory agencies. Outflows continued from Bitcoin ETFs, while positive flows into XRP funds pointed to more selective positioning. Annual US inflation rose above expectations to 3.7%, creating short-term pressure on Bitcoin, while new crypto rules from the SEC and CFTC also brought the question of legal durability into focus. On the market side, Bitcoin searched for directions between $80,0002026-10-16
 Weekly NewsletterWeekly Crypto Break October 9 The crypto asset market this week was shaped by the impact of geopolitical developments on macro conditions, ongoing regulatory efforts in the US and movements in government-held Bitcoin. Bitcoin approached the $80,000 area during the week as rising oil prices and US Treasury yields encouraged more cautious market positioning. In the US, the CFTC said it was working on a new crypto market framework under its existing authority after the CLARITY Act failed to pass the Senate. During the same wee2026-10-09
