What Are Cryptocurrency Chart Patterns?

Technical Analysis
7 min read time
|Updated: 2026-05-22
|
Summary:
|
Although price movements in the cryptocurrency market may seem random and chaotic at first glance, certain patterns repeatedly emerge on charts as a result of investor psychology. These patterns, known as chart formations in technical analysis, allow us to interpret the balance between buyers and sellers in the market (supply-demand shifts).
Especially in highly volatile cryptocurrencies, correctly identifying these patterns is critical for both entering the market at the right time and setting up proper risk management (stop-loss levels).
What Is Chart Pattern?
Crypto chart patterns are graphical formations that emerge as price movements repeat over time, creating specific patterns. These structures, used in technical analysis, help interpret the balance between buyers and sellers in the market.
Identified by analyzing past price data at both macro and micro levels, these structures contain mathematical and psychological clues regarding the direction of the trend. Chart patterns enable analysts and investors to leverage past data cycles to manage risk at more rational levels.
Also see.
Crypto market technical analysis
What Are Crypto Chart Patterns?
Crypto chart patterns are graphical structures used in technical analysis to interpret price movements and market direction. These patterns can provide investors with various signals regarding potential shifts in market direction or the likelihood that the current price movement will continue. These patterns, which can appear on any chart regardless of the time frame, help us understand which direction the market will break out during periods of indecision. In this regard, correctly identified patterns form the foundation of capital preservation and strategy development processes.
In technical analysis, chart patterns are generally divided into two main groups: reversal patterns and continuation patterns. Reversal patterns indicate that a change in the current price trend may occur, while continuation patterns can signal that the price movement may continue in the same direction following short-term consolidation periods. Shoulder-Head-Shoulder (SHS), Inverted Shoulder-Head-Shoulder (ISHS), Double Top, Double Bottom, Ascending Triangle, and Descending Triangle patterns are among the most commonly used chart patterns in technical analysis.
Reversal Patterns
Reversal patterns are chart formations that indicate the current price movement is beginning to weaken and that a change in market direction may be imminent. Frequently used in technical analysis, these patterns often form at support and resistance levels, providing investors with various signals regarding potential upward or downward scenarios. To interpret these patterns more accurately, it is important to evaluate factors such as trading volume, breakout points, and market structure in conjunction. Among the most common reversal patterns are the Head and Shoulders (H&S), Inverse Head and Shoulders (IHS), Double Top, and Double Bottom patterns.
Head and Shoulders (H&S) Pattern
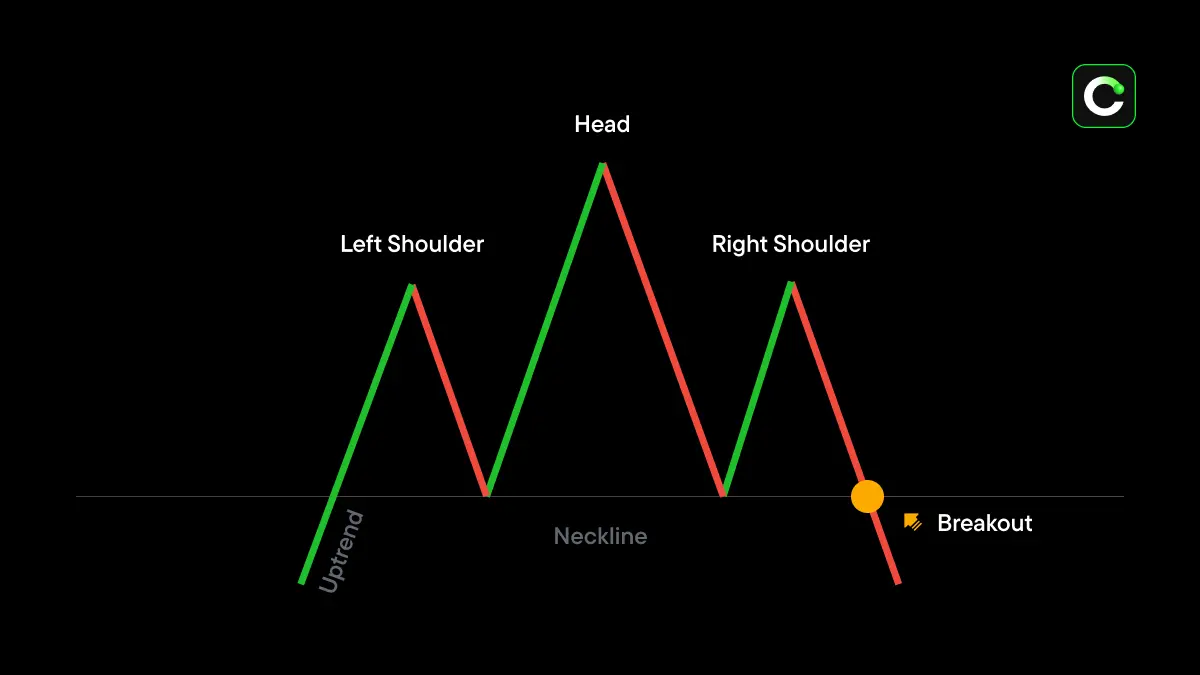
The Head and Shoulders pattern is one of the most well-known reversal patterns, indicating that upward momentum in price movement may be weakening. The pattern consists of three main parts the left shoulder, the head, and the right shoulder and resembles the structure of a human shoulder.
Typically observed following strong upward movements, the H&S pattern can signal a potential price pullback if the support level known as the neckline is broken downward. For this reason, it is classified as a bearish reversal pattern in technical analysis.
Inverted Head and Shoulders (TOBO) Formation
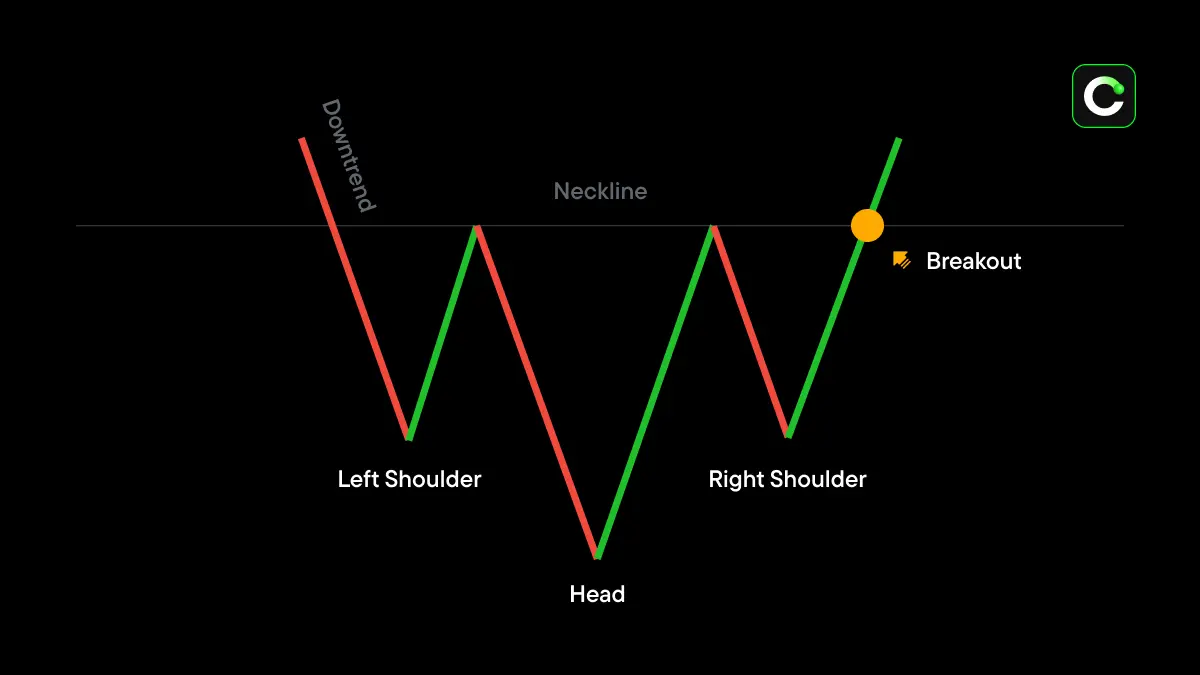
The Inverted Head and Shoulders formation is a reversal pattern indicating that downward pressure on price movement may be weakening and that an upward shift in market direction could occur. Structurally, it is the inverse of the Head and Shoulders (OBO) formation.
In the TOBO formation, price movement consists of three trough areas, with the middle trough level situated lower than the others. A break above the resistance level—which acts as the neckline can be interpreted as a signal that the likelihood of an upward price movement may be strengthening.
Double Top Formation

The Double Top formation is a reversal pattern that signals a potential decline in price movement following an uptrend. It is characterized by two peaks forming at similar levels on the chart.
During the formation, the price first forms the first peak, then pulls back, and rises again to form the second peak. If the second rise fails to surpass the first peak, this can be interpreted as a sign of weakening buying pressure. A break below the support level, meanwhile, can be viewed as a bearish signal.
Double Bottom Formation
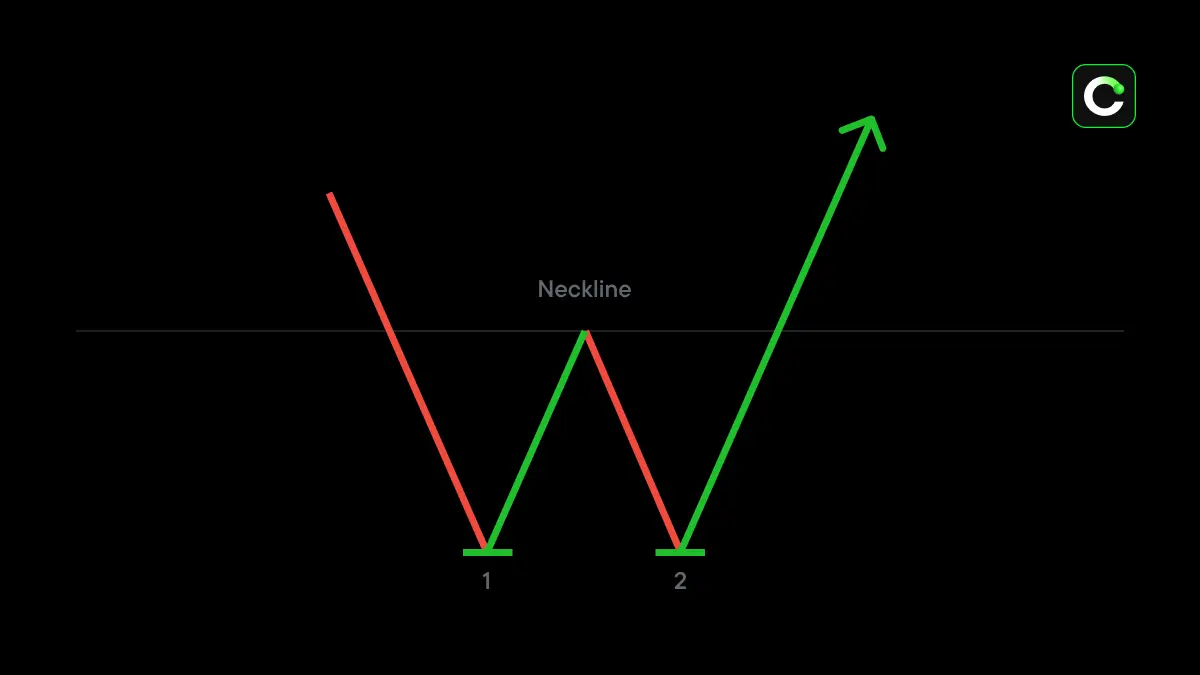
The Double Bottom formation is a reversal pattern that signals a potential weakening of selling pressure in price movements and an increased likelihood of an upward trend in the market. It is characterized by two troughs forming at levels close to each other on the chart.
During the formation process, the price first forms the first trough, followed by a brief rise, and then the second trough occurs. The fact that the second trough forms near the first trough area can be interpreted as a sign that selling pressure is weakening. A break above the resistance level, on the other hand, may signal that buying pressure could be strengthening.
Trend Continuation Patterns
Continuation patterns are chart formations that indicate the current market trend may persist following a brief pause or consolidation in price movement. While these patterns reflect temporary periods of indecision in the market, they do not directly signal a potential significant reversal in price direction. Commonly used in technical analysis, continuation patterns often form following sharp upward or downward movements and can provide various signals that the market’s current momentum may be sustained. Among the most common continuation patterns are the Ascending Triangle and the Descending Triangle.
Rising Triangle Pattern
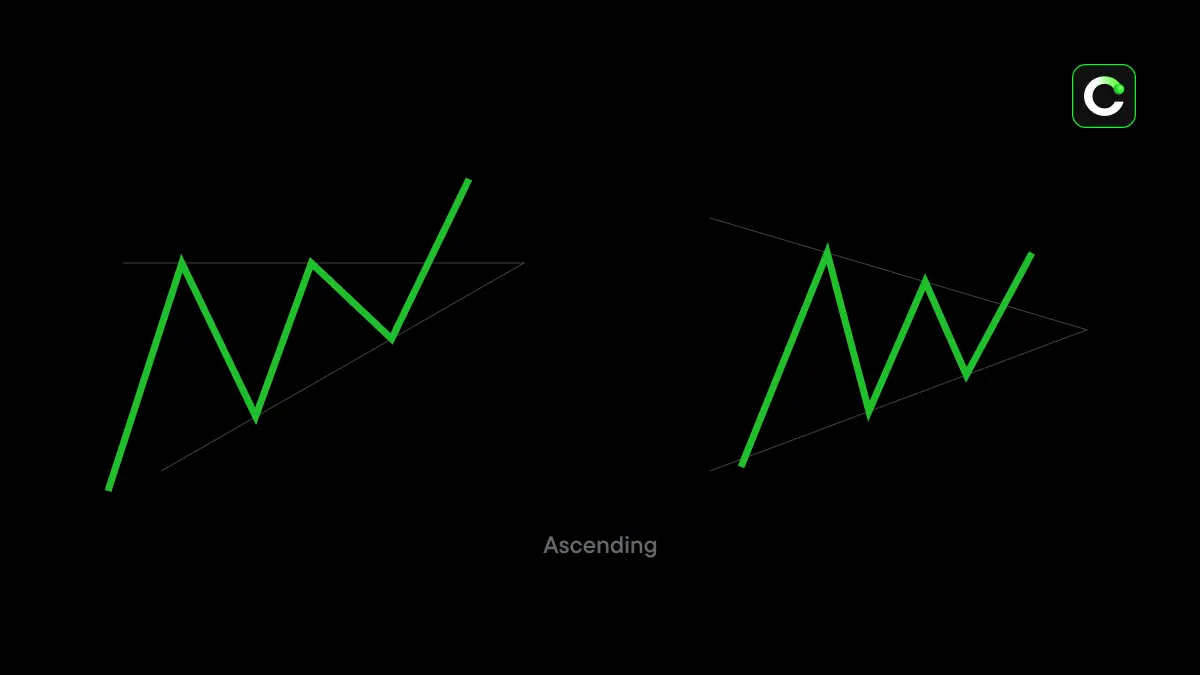
The rising triangle pattern is one of the continuation patterns that indicates upward momentum in price movement may persist. In this pattern, while price movement moves horizontally at a specific resistance level, the lows gradually rise. This creates a structure on the chart that resembles a triangle.
In this pattern, the upper boundary is formed by a horizontal resistance line, while the lower boundary is formed by an ascending support line. If prices break above the resistance level following a period of consolidation, this can be interpreted as a signal that buying pressure may be strengthening. For a more reliable interpretation of the pattern, it is important for price action to touch the support and resistance levels multiple times.
Descending Triangle Formation
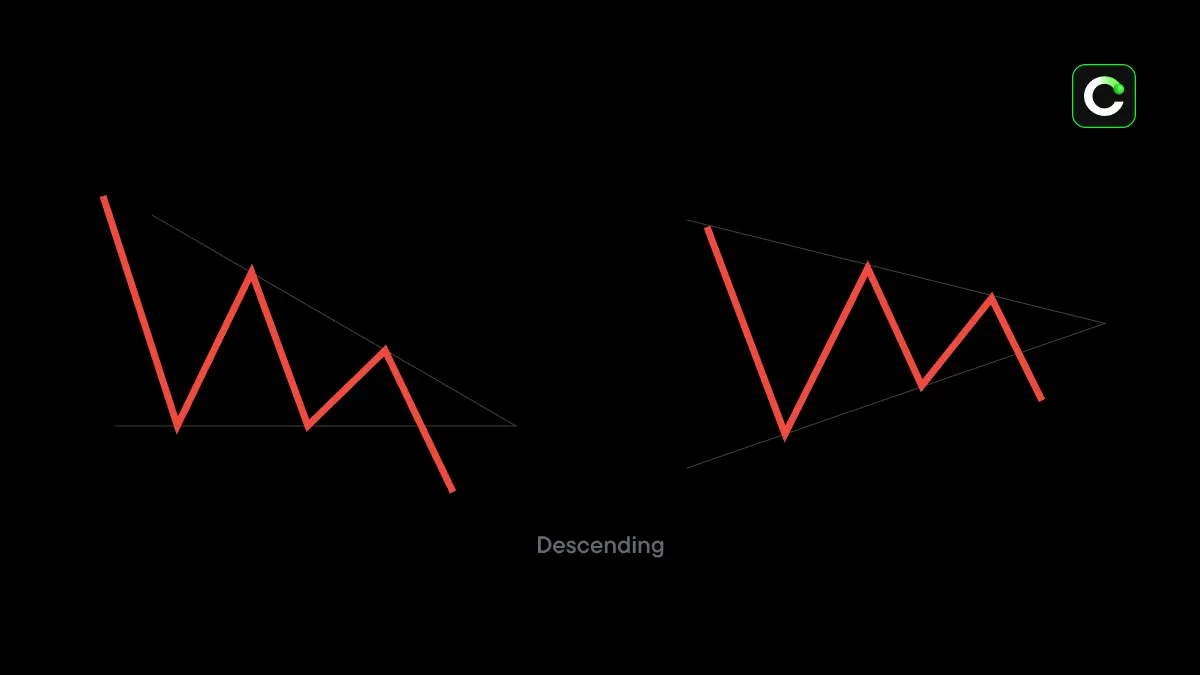
The Descending Triangle formation is one of the continuation patterns indicating that downward pressure on price movement may persist. In this structure, support levels form a horizontal pattern close to one another, while peak points occur at progressively lower levels.
On the chart, the descending triangle pattern forms where the horizontal support line and the downward-sloping resistance line converge. After the price movement progresses within this narrowing area, a break below the support level can be interpreted as a signal that selling pressure may increase. In technical analysis, multiple touches of the price against the support and resistance lines can help make the formation’s interpretation more reliable.
In short, chart patterns are among the technical analysis tools that help interpret price movements and potential trend reversals in the cryptocurrency market. However, analyzing patterns in conjunction with trading volume, support and resistance levels, and other technical indicators rather than evaluating them in isolation can yield more reliable results. Especially in the highly volatile cryptocurrency market, the correct interpretation of chart patterns can help in evaluating market movements more effectively.
 2026-05-22
Legal Notice
The information, comments, and evaluations contained in this content do not constitute investment advice. This content is not intended to be prescriptive in any way and is intended to provide general information. It does not constitute investment advice. CoinTR cannot be held responsible for any transactions made based on this information or any losses that may arise.
 5 Common Mistakes Beginners Make When Reading Crypto Charts
Recommended
 Technical AnalysisWhat Is Market Maker? Summary: Market makers contribute to maintaining liquidity in the markets and ensuring smoother trading by continuously providing bid and ask prices. A market maker quote is the bid and asks price and volume information submitted to the system by an authorized market maker. In crypto markets, market makers do not directly set prices, but they can help balance bid-ask spreads and limit sudden price movements by increasing liquidity. Sufficient liquidity is necessary for tra2026-06-09
 Technical AnalysisWhat Is an Indicator? What Is It Used For? Summary: Indicators can provide insights into the direction of a trend, the strength of price movements, and potential buy and sell zones by analyzing market data such as price, volume, and volatility. Indicators such as MA, MACD, RSI, Bollinger Bands, Stochastic Oscillator, ADX, ATR, VWAP, and OBV are used for different purposes in technical analysis. For the most reliable analysis, indicators should not be used in isolation but evaluated in conjunction with support and resistance2026-06-09
 Technical AnalysisWhat Is Arbitrage? Summary: Arbitrage is a trading strategy that aims to generate profit by exploiting price differences of the same asset across different markets. In these transactions, the buying and selling steps are typically executed simultaneously. Currency arbitrage, cross-rate arbitrage, and three-way arbitrage are among the most common types of arbitrage. Rapid price fluctuations in cryptocurrency markets can make it essential to monitor arbitrage opportunities in real time. When2026-06-03


