
Weekly Crypto Break August 21

Weekly Newsletter
3 min read time
|Updated: 2026-08-21
The
crypto asset market this week was shaped by US regulatory developments, renewed spot ETF demand and a sharp recovery in Ethereum. CFTC Chair Michael Selig signaled that the agency could move forward with crypto-related rulemaking even if Congress fails to advance the CLARITY Act, while Bitcoin and Ethereum ETFs recorded stronger inflows.
Bitcoin moved from around $63,000 at the beginning of the period to the $77,000 area, while Ethereum climbed from below $1,900 to around $2,400. Regulatory momentum and ETF demand supported the broader market recovery, although positioning among large investors remained selective.
CFTC Signals Action as the Market Waits for CLARITY
CFTC Chair Michael Selig said the agency could move ahead with new crypto rules if Congress fails to reach an agreement on the CLARITY Act. Work is already underway around areas including leveraged crypto trading and protections for developers, while the legislative process is expected to remain in focus when the Senate returns in September.
Why does it matter?
The comments suggest that US crypto regulation may continue to evolve even if legislation is delayed. Agency-led rules could provide near-term clarity, although the outcome of CLARITY remains important for a broader and more durable market structure framework.
Bitcoin ETFs See a Four-Day Inflow Streak
US spot
Bitcoin ETFs recorded roughly $606 million in net inflows on August 20, their strongest daily result since May 1 and the fourth consecutive day of positive flows. The improvement in ETF demand coincided with Bitcoin’s recovery during the week.
Why does it matter?
ETF flows provide a useful signal for demand through regulated investment products. The recent inflow streak points to improving market sentiment, although ETF demand alone does not determine the sustainability of a price move.
Ethereum ETF Demand Strengthens as Large Holders Diverge
Ethereum gained roughly 29% over the week, moving above $2,400 and reaching its highest level in around four months. US spot
Ethereum ETFs also recorded approximately $221 million in inflows on August 20.
Onchain activity showed a more mixed picture. Some large holders moved ETH away from exchanges, while others reduced exposure around the $2,400 area, highlighting a combination of accumulation and profit-taking.
Why does it matter?
Stronger ETF demand supports the broader Ethereum narrative, but diverging whale behavior shows that positioning remains selective rather than uniformly bullish.
Bitcoin Price Chart
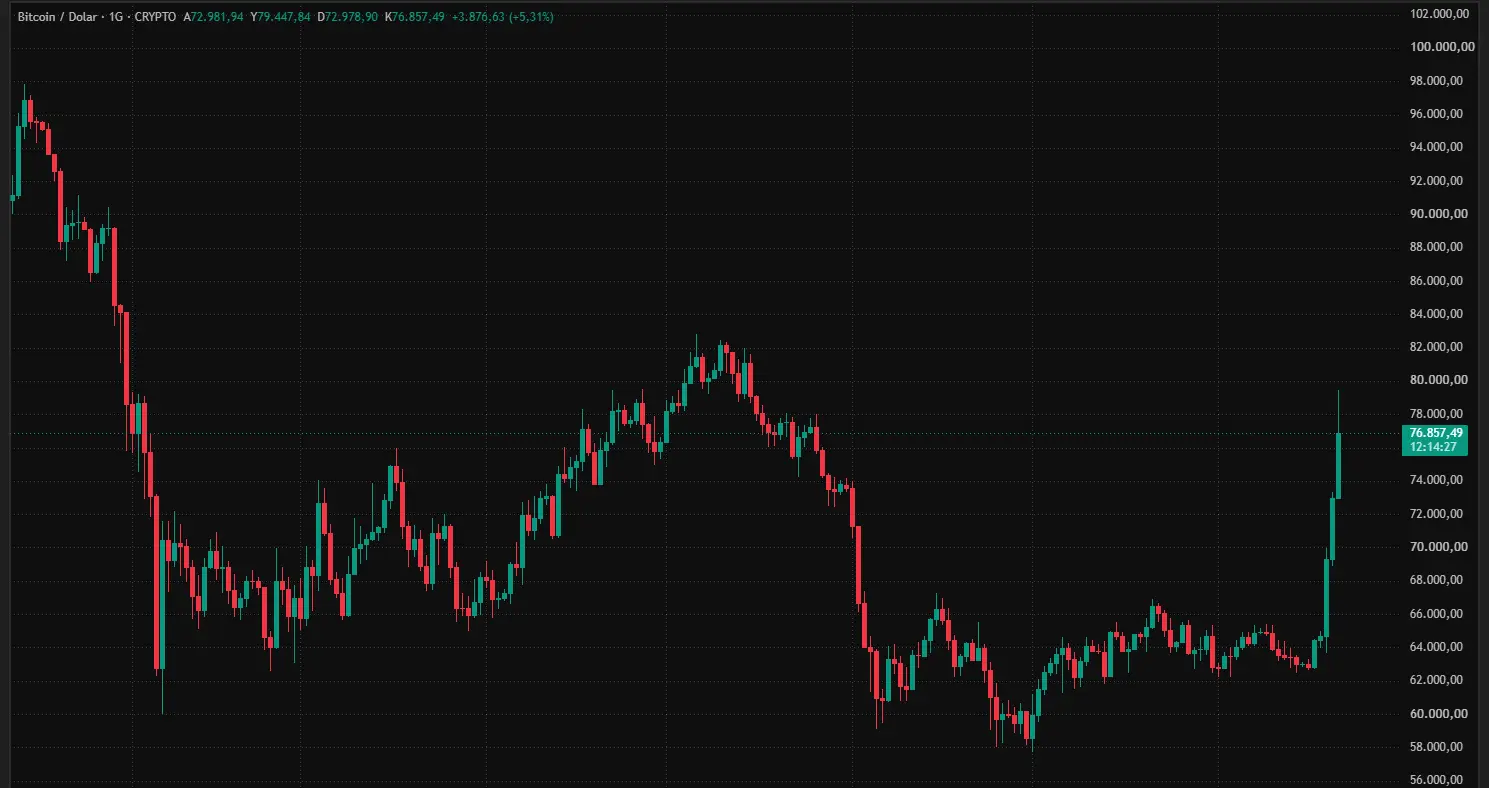
Bitcoin price rose from approximately $63,000 on August 14 to around $77,000 on August 21, testing the $79,300 area intraday. BTC gained notable momentum during the second half of the week.
In the short term, the $75,000–$77,000 range stands out as a new consolidation zone, while the $79,000 level is the first key area to watch on further upward moves. On the downside, the 200-day moving average near $69,000 remains an important reference for the broader outlook. The Strategy report also noted that Bitcoin’s move above $77,000 brought the price back above the company’s average acquisition cost of approximately $75,385.
Ethereum Price Chart
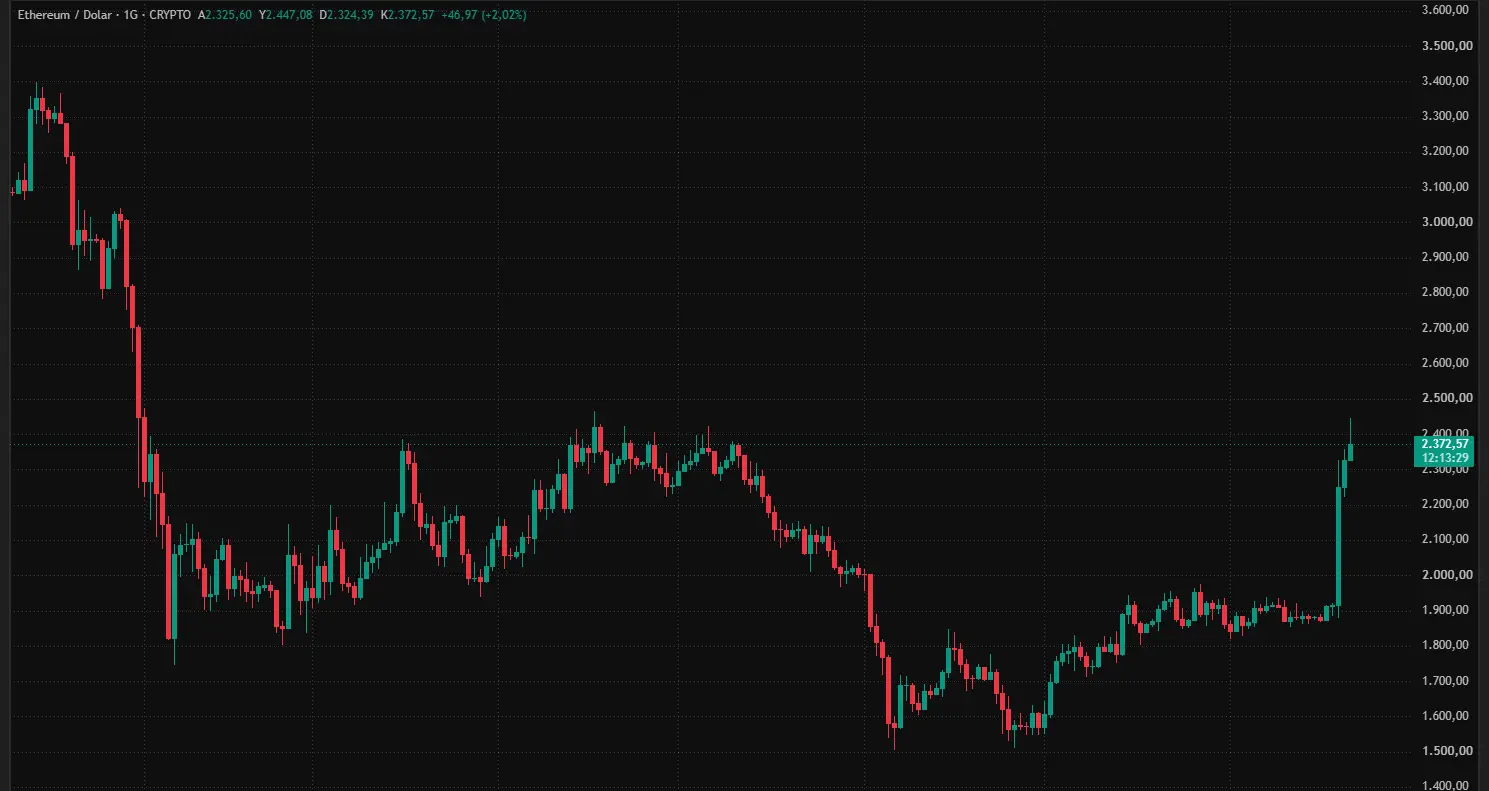
Ethereum price delivered a strong recovery over the week, rising from approximately $1,882 on August 14 to around $2,400 on August 21. ETH also tested the $2,446 area intraday, making it one of the strongest-performing major crypto assets of the week.
In the short term, the $2,300 level stands out as the first key consolidation area, while the $2,450 region remains important for a continuation of the upward move. Continued ETF inflows are among the factors supporting Ethereum’s outlook, while the price’s ability to hold around $2,400 could be important for determining its near-term direction.
 2026-08-21
Legal Notice
The information, comments, and evaluations contained in this content do not constitute investment advice. This content is not intended to be prescriptive in any way and is intended to provide general information. It does not constitute investment advice. CoinTR cannot be held responsible for any transactions made based on this information or any losses that may arise.
 Weekly Crypto Break August 28
Recommended
 Weekly NewsletterWeekly Crypto Break October 2 In the cryptocurrency market, new steps toward stablecoin regulation in the U.S., third-quarter fund flows in spot Bitcoin and Ethereum ETFs, the launch of the application process for the UK’s new crypto asset regime, and the impact of the U.S. government shutdown on regulatory processes were among the main topics between September 25 and October 2. The Fed opened two new draft regulations for payment stablecoin issuers for public comment. U.S.-listed spot Bitcoin and Ethereum ETFs ended the th2026-10-02
 Weekly NewsletterWeekly Crypto Break September 25 In the cryptocurrency market, spot Bitcoin and Ethereum ETF flows, blockchain-based payment infrastructure developed by traditional financial institutions, initiatives related to the international use of stablecoins, and regulatory developments in the U.S. were among the main topics between September 18 and September 25. U.S.-listed spot Bitcoin and Ethereum ETFs recorded approximately $877 million in total net inflows on September 22. Swift moved into the first use phase of its blockchain-base2026-09-25
 Weekly NewsletterWeekly Crypto Break September 18 In the cryptocurrency market, the Federal Reserve’s interest rate decision, spot Bitcoin ETF flows, a new stablecoin-focused blockchain infrastructure, and crypto asset regulations in the United Kingdom were among the main topics between September 11 and September 18. The Fed raised its policy rate by 25 basis points, while U.S.-listed spot Bitcoin ETFs recorded their largest daily net outflow since June. On the stablecoin side, Circle launched the public mainnet of the Arc network. The UK Fina2026-09-18
